Can't get javascript debugging to work with Rider

Hopefully we can get this figured out. I only have two days of my trial and was ready to buy a license to the full suite of tools when i found out today that javascript debugging was not working for me. I probably spent 1/2 day trying to get it to work but unfortunately i didn't make any headway. I took lots of screenshots hopefully that helps. I am using Windows 10. Here is the version of rider i have:

Here is my configuration i have setup:

The red array is pointing to the front end web app that will serve the javascript file i want to debug. Right below you will see an npm script that is ran that uses webpack to build our javascript bundle. Most of our javascript exists in *.vue files (we use vue.js) & we use typescript. Source maps is inlined into the bundle. Here is how i have that specific .net core app defined:

As you can see i have javascript debugger enabled. As far as i know i have all the required javascript plugins installed/enabled:
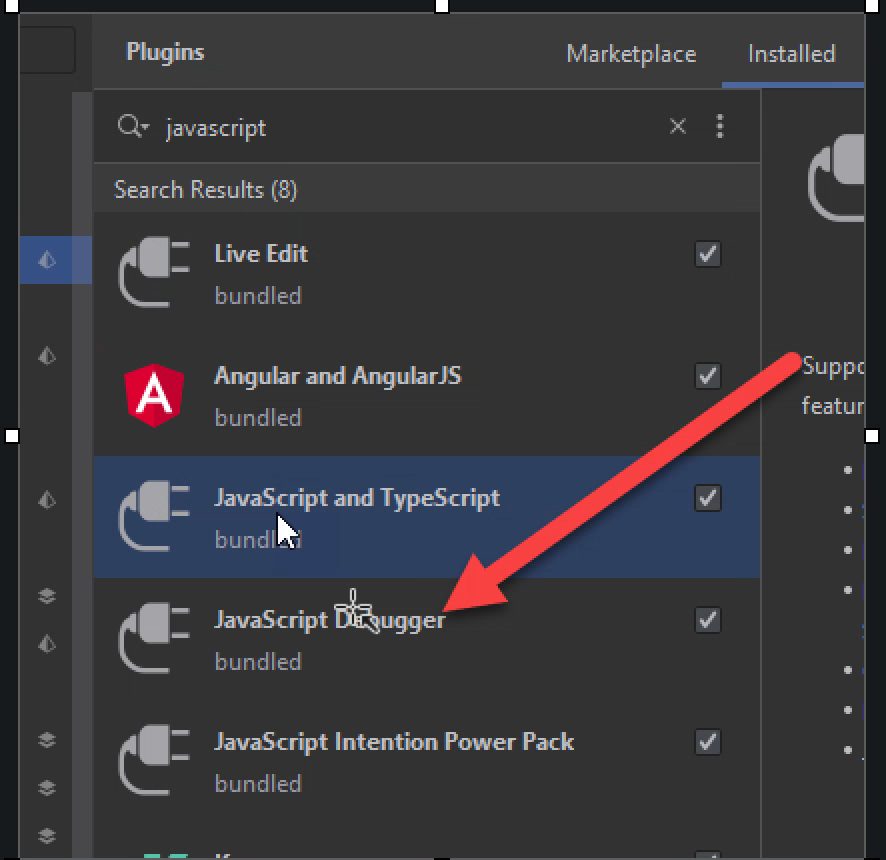
So when I have that "with javascript" checkbox checked about it creates the following when you run (Javascript Debug):

You can actually see my mouse hovering over the bundle i'm trying to debug into. When i run the project I actually can go into the developer tools in chrome and find the specic source files I want to debug into and set breakpoints there and they work but thats not a great experience. I can run the project either in VS Code or Visual Studio and i'm able to debug javascript but other than that i feel the experience in rider is quite superior to either VS Code or Visual Studio. I have tried to use both Chrome & Edge and neither work.
I would like to purchase the entire sweet but without javascript debugging abilities its a no go of course because we have quite a bit of front end code. Is there anyway i can get my trial extended until we figure this out?
thanks...
Please sign in to leave a comment.
>When i run the project I actually can go into the developer tools in chrome and find the specic source files I want to debug into and set breakpoints there
could you share screenshots illustrating this? What are your scripts URLs in Dev Tools? You could try mappings these URLs to the corresponding source roots in JavaScript Debug run configuration (see Debugging JavaScript Deployed to a Remote Server )
Elena Pogorelova Sure. Here is a screenshot of chrome and me setting the breakpoint manually
Which is the same breakpoint i set in Rider:
If you need to see where in the source heiarchy the source file is here you go:
Its under webpack of cource since this is a webpack build.
Here is where the file is being served from in the browser:
which is a little different from where everything is being built to `wwwroot`. Dotnetcore of course, by default puts all build assets in `wwwroot` but when you run your site the root of your site is in wwwroot. I will read into the link you provide and will see if that makes a difference & let you know.
thanks....
Elena Pogorelova, OK i tried it and it doesn't seem to work. Rider seems to be confused on the difference between the webpack bundle & the actual vue file. Here is how i set it
and then Rider gave me an error where i set the breakpoint:
Of course we don't have a "payments.vue" being served. payments.vue is bundled in webpack in the "contribution-reporting.bundle.js" file. Hopefully this gives you a clue on whats going on wrong
Please try specifying the URL mappings for your source folder (Scripts/ts/contribution-reporting/components or whatever it looks like), not for a bundle. Copy the URL your payment.vue script has in Dev Tools (right-click on a script, Copy link address), remove the script name from URL (as this has to be a mapping for folder, not file), specify this URL as Remote URL for the components folder)
I didn't put the `http://` portion in. It didn't work. I also played with the different type of sourcemaps webpack will output. I tried the most aggressive sourcemaps & that didn't make a difference either. Elena Pogorelova
Hmm... From the dev tools screenshots it seems that the URL should start with webpack:// and not with http://. And you have again specified the mappings for the bundle instead of adding them for your src folder
I can get chrome to open with the developer tools using the --auto-open-devtools-for-tabs flag and the original source can then be seen in the scripts widow under webpack and opened with "show actual script". It is still not possible to set breakpoints in Rider but those set in Chrome are honored.
I had this same issue, but with a Blazor WASM project and found a solution.
I had to create a second configuration for JavaScript Debugging specifically ( Run > Edit Configuration ):
Notice the mapping, where on the left the absolute path of my js root folder on my computer is defined, and on the right, the remote URL is defined. That's crucial. If you're unsure of the remote path, you can get the path to your JS file in your browsers developer tools (in browser with your app running press F12, and click ‘Sources’ and find the JS file you want to debug) by right clicking a js file it to get the path like this:
Then just remove the filename of the javascript file so you're left with the remote path to the folder.
Then, to get the JS debugger breakpoints to work, I first run my .NET WASM project from Rider, either regularly or through debugging, and then also run the JS Debug configuration in the debugger.
If this helped you, please respond with All Hail, King Russell!