Can't Debug/Specify Port in .NET 4.8 Azure Function isolated in Rider

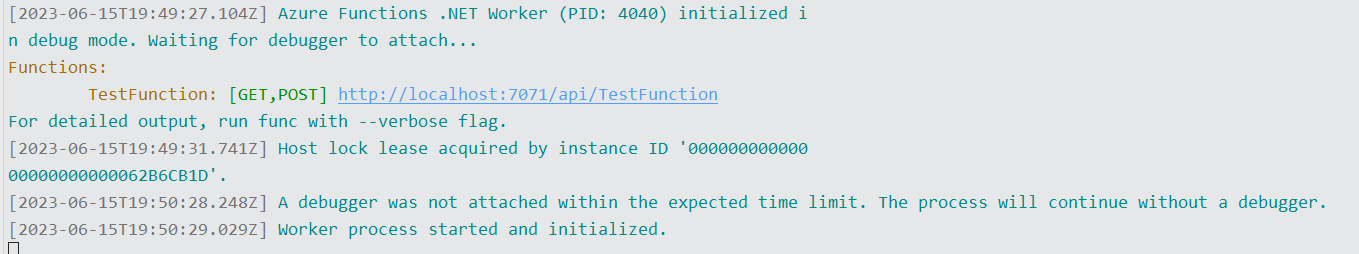
I am unable to debug an Azure Function in Rider. I get "A debugger was not attached within the expected time limit. The process will continue without a debugger." I've created a new solution with the standard function template and getting the same results. It works fine in Visual Studio. Not sure what I am missing, so any help would be appreciated.
Azure Toolkit Version: 3.50.0.1595-2023.1
Rider Version: 2023.1.2 RD-231.9011.39 May 17, 2023
Rider is also ignoring the launchSettings.json in the Azure Functions Host configuration. According to this post they said Visual Studio doesn't use launchSettings.json either, but that's not the experience I have. It uses the port number that's supplied in the launchSettings.json. Is there a way I can specify the port number in Rider?
Thanks!
Please sign in to leave a comment.
Hello Aaron,
Thank you for contacting Rider support.
Please ensure that you launch the Azure Funtions Host run configuration, but not the .NET Launch Settings Profile (hope you find this explanation informative).
You can change the port number by adding it as argument for Function host arguments.
If that doesn't help, please let me know.
Have a nice day!
Thanks for the quick reply Dmitry Kazantsev. I am currently using the Azure Functions Host, but the debugger times out.
Console Message:
Also, Is there no way to have it read the port number from the launchSettings.json file?
Hello Aaron,
Regrettably, there is no way to make Rider take port number from the launchSettings.json file. Feel free to upvote the following feature request to demonstrate your interest: Extract Azure run configuration from launchSettings.json for Azure Functions projects.
Debugger doesn't attach
This is weird. We would appreciate it if you could share Rider logs as described below:
Also, as a workaround, I suggest trying to launch your confriguration without debugger (via the Run button) and attaching the debugger separately (Run | Attach To Process | find the "func" process).
Have a nice day!
Hi Dmitry Kazantsev,
Here is the upload ID for the logs: Upload id: 2023_06_20_uQtCKfsSJffcHhdEXYxrYT (file: rider-logs-20230620-08220216914922785911261119.zip)
Please let me know if you need any additional information.
Thank you
Hello Aaron,
Thank you for the details shared.
Now, I see the problem and was able to reproduce it.
Would you mind checking if following steps would work?
Have a nice day!
That works, thanks Dmitry Kazantsev.
This seems less than ideal to have to do this every time. Is there no way to get it to automatically attach the debugger?
Regrettably, there is no way to avoid attaching the debugger manually at the moment. Apologies for the inconvenience.
This is a bug and we have already applied a fix on our side. A fix will be added to the upcoming release (Rider 2023.2). It is likely that the fix will be added to one of the upcoming EAP releases. (https://www.jetbrains.com/rider/nextversion/)
Should you have any other questions or difficulties, please let me know.
Have a nice day!
No worries,
I appreciate all your help!
Thank you!
Hello Aaron,
I am pleased to inform you that the fix is now available starting from Rider EAP 5.
Please ensure you have the latest version of the Azure Toolkit plugin.
Have a nice day!