How to copy the call stack as text?

I'm pretty sure there used to be a “Copy” button in the context menu in the call stack not long ago, where has it gone?
I want to copy the entire call stack as text.
Please sign in to leave a comment.
Hello Jefferson,
Thank you for contacting Rider support.
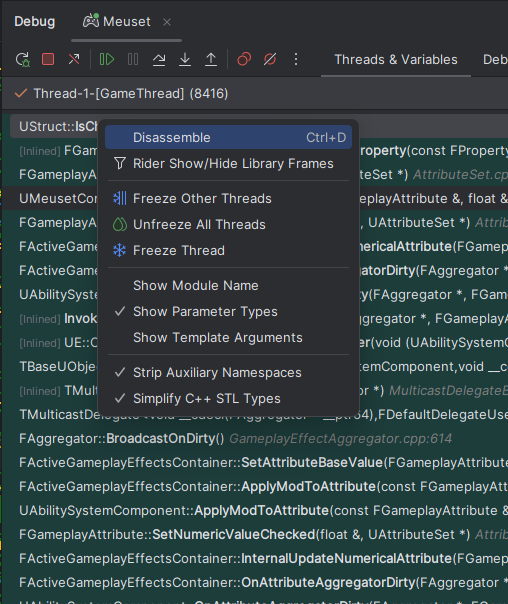
You are right, it is supposed to be there under the “Disassemble" item in the context menu.
Would you mind sharing IDE logs, collected shortly after reproducing the issue? (Help | Collect Logs and Diagnostic Data)
Please upload it to the Upload Service and let me know the Upload ID.
Have a nice day!
Dmitry Kazantsev then I think this may be related to another bug. There is a particular crash condition (a stack overflow) where, when it happens, Rider fails to collect debug data on variables (`this` and other variables stay forever in “Collecting data…” status). The same happens when navigating up the call stack.
When that happens, right-clicking the call stack fails to show the “Copy” button.
I don't know if relevant, but after about 100 or 150 entries in the call stack, it also shows “Loading…” as the last (or first? The bottom-most one) call stack item, eternally.
Upload id: 2025_10_23_rHzHm3ZgRn9R5FDew4iD1m (file: rider-logs-20251023-1150175080516847022999068.zip)
Hello Jefferson,
Thank you for the details shared. Unfortunately, yet I see no clue in the logs and wasn't able to reproduce the issue. Would you mind elaborating on the circumstances when the issue occur and sharing another log bundle with extra trace scenario?
Hope to hear from you soon.
Hi,
When the crash happened, the Call Stack failed to show any information this time. See the first (oldest) log zip file, I placed a print.png there.
I pressed F10 and then it showed the call stack. I navigated to the origin of the crash (a call in `UMyAttributeSetBase::PostAttributeChange`), and it failed to produce debug info for the variables there (see the second log zip file, print2.png).
Upload id: 2025_10_27_xwsbETKoYLa9LJgapEvi1W (files: rider-logs-20251027-15330212332685765990698341.zip, rider-logs-20251027-1531016623507865798191569.zip)
In both cases, “Copy stack” was not shown as an option in the context menu.
As for repro steps, I can post the code that causes the crash, but not the whole project. I suppose you should be able to reproduce it by using any game sample from Epic that uses GAS, such as Lyra or Stack-o-Bot or the ActionRPG one. Override PostAttributeChange in the game's main AttributeSet class:
Then play the game, ensure that you have some GameplayAttribute that starts out at some positive value, and apply some GameplayEffect (of infinite duration) that would take that attribute down to -1 or less.
Hello Jefferson,
Thank you for the details shared. I'll try to reproduce it by myself with the information you provided. Will update you on my findings.
Meantime, I would appreciate it if you could share another log bundle (apologies for the confusion, my bad) with the “CppDebugger” trace scenario enabled, instead of “Debugger”:
Additionally, switch to the Debugger Output (LLDB) tab in the Debug tool window and try invoking “frame var”. Let me know if you can invoke the command and will there be an instant output or not:
Have a nice day!
After reproducing the issue, typing “frame var” into the LLDB console produced no output:
However, it caused the same effect as I described in the previous post after pressing F10: the call stack loaded, but I still could not inspect variable values (eternal “Collecting data…”) and the Copy button in the call stack did not show up.
I tried typing frame var again in the console after this, again no output.
Upload id: 2025_10_27_koJzunLBP9KD9XsyAE6W5p (file: rider-logs-20251027-1912257517975939064591417.zip)
By the way, something else that may be relevant for debugging this, are my GameName.Target.cs settings:
I had disabled UnityBuild iirc because I read somewhere that might cause the debugger to take longer to collect data.
Unreal version is 5.6.1 from the Launcher.
Hello Jefferson,
Apologies for the late reply. Thank you for the details shared. I registered this issue on our tracker: RIDER-132619 Call Stack Context Menu: 'Copy Stack' is missing in specific conditions
A developer will take a look.
If there is anything else I can assist you with, please tell me.
Have a nice day!