Rider.Net VERY slow at analysing project after upgrade to 2026.2.3 - chewed on my .net solution for 20 hours and it's not done

Hello,
After I upgraded to version 2026.2.3, I can no longer open my C# solution because Rider.Net spent already 20 hours analysing all the files in the solution and it was not done. I stopped it.
What is going on?
JetBrains Rider 2026.2.3
Build #RD-262.10968.135, built on September 24, 2026
Source revision: 26f81f17837b1
Runtime version: 25.0.4+1-b508.27 amd64
VM: OpenJDK 64-Bit Server VM by JetBrains s.r.o.
Toolkit: sun.awt.windows.WToolkit
Windows 10.0
Exception reporter ID: 30102412ef47baa-3775-4577-819c-fe5b3fa76fb4
JCEF version: 144.0.15-262-b37
.NET Core v10.0.9 x64 (Server GC)
GC: G1 Young Generation, G1 Concurrent GC, G1 Old Generation
Memory: 4096MiB
Cores: 8
Registry:
ide.experimental.ui=true
ide.mac.bigsur.window.with.tabs.enabled=false
rider.codeVision.zeroWidth.preload.enabled=true
rider.codeVision.fitToContent.enabled=true
trace.state.event.service.url=https://api.jetbrains.cloud/trace-status
rider.debugger.dotnet.mixed.mode.enabled=true
find.in.files.split.actions=false
find.in.files.split=false
vfs.windows.use.buffered.directory.stream=false
Non-Bundled Plugins:
me.rafaelldi.aspire (2.8.1)
com.intellij.resharper.azure (4.8.4)
de.netnexus.camelcaseplugin (3.0.12)
me.laria.code.idea_caseconv (0.8.1)
org.antlr.intellij.plugin (1.26)
com.jetbrains.space (262.8665.173)
com.intellij.tasks (262.8665.173)
com.intellij.tasks.timeTracking (262.8665.173)
Thanks
Please sign in to leave a comment.
Hello,
Could you collect Rider logs with additional trace scenarios enabled so we could investigate this behavior? Follow the steps below to collect the logs.
You can attach the logs to this ticket or send them to us via the Upload Service and let me know the Upload ID in this thread.
There's a patch to Rider today that seems to have resolved this, testing a (new) Files view that was causing the IDE to slow.
https://youtrack.jetbrains.com/articles/DOTNET-A-413/Rider-2026.2.3.1-release-notes
Can you please tell me if the patch fixes this issue: https://youtrack.jetbrains.com/issue/RIDER-143402 ?
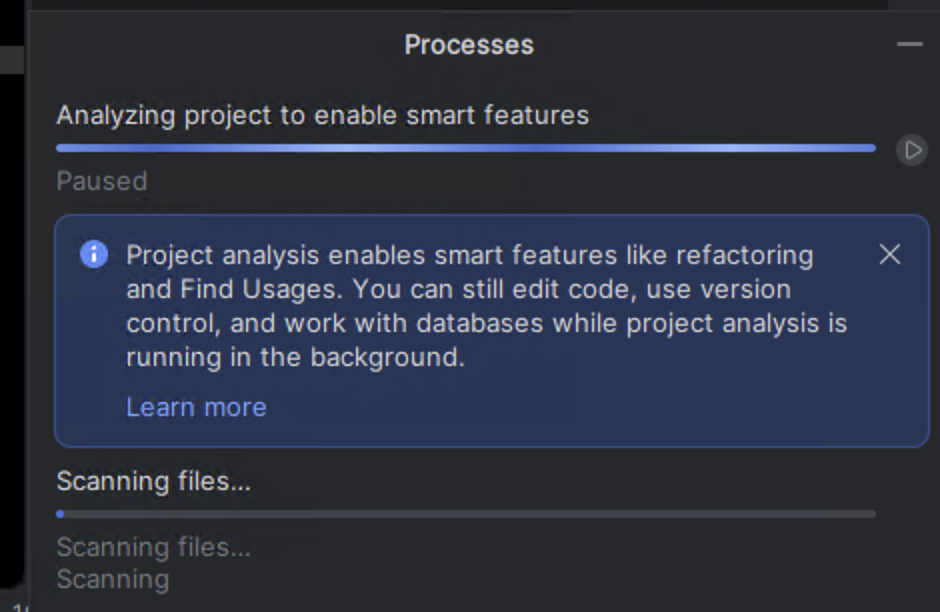
Actually, I guess I posted too soon - it is better, consumes less CPU (so the IDE is mostly usable) but is still ‘stuck’ scanning files in a large mono-repo. I've reverted back to a previous version which doesn't appear to get stuck.
Here are some logs (which, ironically, were stuck behind the scanning job).
Upload id: 2026_10_02_9XgtiYxZDaCE7EXGMkh8Wb (file: rider-logs-20261002-14321811846106859581662741.zip)
So I came across this issue after Rider became unusable today: https://youtrack.jetbrains.com/issue/RIDER-143195
Removing the `workspace` folder in <your user>\AppData\Roaming\JetBrains\Rider2026.2 and the .idea folder (as suggested; see issue if using *nix) gets everything restored (confirmed working in EAP too).