UE5 Breakpoint will not currently be hit.

UE5, Win10 (x64)
Hello! I have a project with GAS Companion and Twisted Bytes Interaction System plugins. They use the Ability System. TBIA akso have an integration tutorial which I've followed to bind these plugins.
So I have:
UTBIA_AbilitySystemComponent : public UGSCAbilitySystemComponent
UGSCAbilitySystemComponent : public UAbilitySystemComponent
The problem is GSCAbilitySystemComponent has a function:
FGameplayAbilitySpec* UAbilitySystemComponent::FindAbilitySpecFromGEHandle(FActiveGameplayEffectHandle Handle)
I have an Actor which has TBIA_AbilitySystemCompoent and I get it and trying to call this function but for some reason it's not being called.
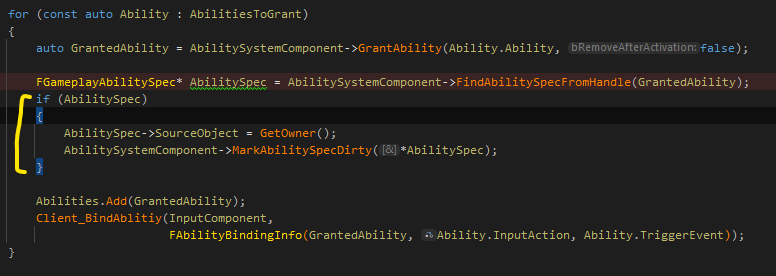
I set a breakpoint inside this function and build the project and Rider says that it won't be hit (see the image):

When I used only GAS plugin that part of the code (where I call the function) worked fine. But when I integrated TBIA it stopped working.
See the image below of the code where I try to call the function. The yellow part I marked is never been triggered because the AbilitySpec variable is always NULL
I've checked this thread and the solution did not help.
Please sign in to leave a comment.
I've made a test project to try out (named MyProject). Copied 3 plugins I'm having troubles with (copypasted). And it all worked fine. I've compared .uproject and .build.cs files of my initial project (Project_2) and MyProject to find any issues but didn't noticed any (pic 1, 2):
Also in the MyProject, Rider is able to go to the definition of the GameplayAbilities.uplugin by clicking Ctrl+LMB on the .uproject tab. In Project_2 it says "Cannot find declaration to go" (pic 3):
Also, highligthted areas show this (pic 4):
I beleive that is the problem but don't know how to fix that. The question is how to make Rider or UE be able to find and go to the declaration of .uplugin?
Hello Timdogger,
Thank you for contacting Rider support.
Apologies for keeping you so long without an answer.
Would you mind trying the following options?
File | Settings | Languages & Frameworks | C++ | Unreal Engine | Index third-party code, Index pluginsare enabled; Then invalidate solution caches viaFile | Invalidate Cachesand restart Rider;File | Open | Open | select {gamePath}/{game}.uproject);I will be waiting for your response.
Have a nice day!
Same problem, and have tried above options, does not work
Hello Tarnishablec,
We would appreciate it if you could elaborate on the issue you encounter and share additional information as described below:
Have a nice day!
Hello Dmitry,
Upload Id is 2024_04_09_QCysNi6RhY4EEzvfVo3kzw
Hello,
Apologies for the delay in getting back to you.
Would you mind sharing the following details with us?
Thank you in advance and have a nice day!
I Installed UE through launcher and have Editor symbols for debugging installed.
I can debug engine sources and project plugins (plugins in project's /Plugins/ folder), but can not debug marketplace plugin which is in Engin/UE5/Plugins/Marketplace folder.
I can debug in Visual Studio 2022 without any problem.
Below is same line of code adding breakpoint in Rider & VS


Hello,
Take my sincere apologies for taking so long to respond.
I verified this behavior.
Debugging plugins from marketplace works fine while starting UE editor right from Rider via the Debug button.
However, if you launch UE without debugger attached and then attach debugger via Run | Attach to Process, you might encounter this issue: RIDER-81272 Unable to attach Unreal Editor for debugging.
The issue is not in Rider itself, as it is also affects Visual Studio. The Increase the Number of Modules Loaded When Attaching the Debugger briefly explains why such a problem occurs: Debuggers on Windows are limited to loading the symbols for 500 modules when attaching to a running process. Unreal based projects can have more than that limit depending on the version and the plugin configuration.
If you experience a similar behavior (breakpoints are not being hit after attaching debugger, but works fine if you start Debug right from Rider), try the following steps to see if that helps:
If the issue persists even when starting Debug right from Rider or after applying the workaround, please follow the steps below and let me know the results:
image list;image listone more time;One more thing you can try is to ensure that the your plugin comes with .pdb file. It should be in
{PathToPluginInstallation}/Binaries/Win64. In my case if was:Engine\Plugins\Marketplace\BetterDebug\Binaries\Win64. In case the .pdb is missing, it is probably a plugin issue.Feel free to submit a dedicated tickets, so that we can verify exact scenarios and assist on case basis.
Hope to hear from you soon.
Have a nice day!
Tarnishablec, do you launch Debug right from Rider or you launch UE editor and then attach debugger?
Got the same problem. Debugging unreal source code works. Debugging a marketplace-Plugin (logic driver) and the breakpoint will not be accepted.
The same problem occurs with any marketplace plugin. Did all the steps above but the issue still persists. This is my installation:
Regedit:
Plugin-Directory:
Rider version is 2024.3, Win10, UE5.3.2
Uploaded (LaunchedFromRider.txt, attachedFromRider.txt, capture.mp4 and rider logs)
Upload-ID is 2025_01_27_6NYF9Qt2Y1dXN2bX34hH3r
Is there anything else I should try or provide?
Hello Delaron,
Thank you for the details shared. I reproduced this issue and submitted this bug to our tracker to investigate it alongside a developer: RIDER-122443 Debugging plugins from Marketplace doesn't work
Please watch the issue for further updates.
Have a nice day!
BTW… opening the uproject and the above steps of invalidating cache, worked for me.