Rider Profiling Instructions (.NET process)
Note:
This article is deprecated and might no longer reflect the latest Rider updates. Please refer to SUPPORT-A-1354 Rider Profiling Instructions (.NET process) for an up-to-date version of the article.
NB! This article covers only .NET Rider process. For Java process (JetBrains Rider) related issues refer to this article.
MacOS and Linux:
In case you see that Rider slows down on your Mac, and/or dotnet CPU usage spikes up to 100%, please take the following steps:
- Call the action "Help | Diagnostic tools | Profile Backend with Sampling".
- Wait until Attaching to profiler process finishes (a progress bar in the bottom status bar will indicate about it and you will see that Profiling is in progress).
- Perform the actions leading to high CPU usage.
- Wait for a minute and then stop profiling with the action "Help | Diagnostic tools | Backend: stop profiling".
- In the bottom right corner you will see a notification popup that a snapshot has been captured and a link to the snapshot file. Collect this snapshot.
- Create a new issue in the Rider issue tracker. In the issue, provide a short description of the performance problems you're experiencing, share the collected snapshot via uploads.jetbrains.com service, and let us know the exact ID of your upload.
Windows:
Embedded profiler
- Start Rider;
- Call "Help -> Diagnostic Tools -> Profile Backend with Timeline | Sampling or Capture Backend Memory Snapshot" if your Rider version is 2020.1+ and Tools -> Backend Profiling -> Start Sampling | Timeline or Dump Memory if you use Rider2019.3 and older version;
- Wait until you see "Profiling in progress: stop it manually" message at the bottom;
- Perform actions which are slow in Rider (typing, switching between documents, building, etc.);
- To stop profiling, call "Diagnostic Tools -> Backend: Stop Profiling";
- At the bottom-right corner, you will get a popup with a performance snapshot file name and "Show in Explorer" link to open a folder;
- Share the file with us, some ways are mentioned here;
- Create a new issue in the Rider issue tracker. In the issue, provide a short description of the performance problems you're experiencing, and specify the name of your snapshot.
Standalone JetBrains dotTrace profiler
These steps are applicable for Windows and MacOS.
- Download and install JetBrains dotTrace. If you don’t have a suitable license, you can use the 30-day free trial.
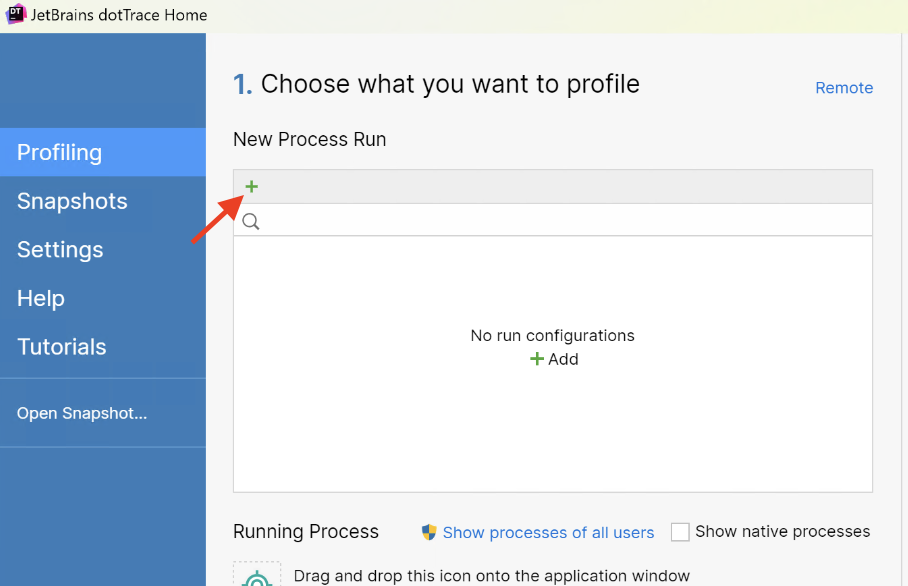
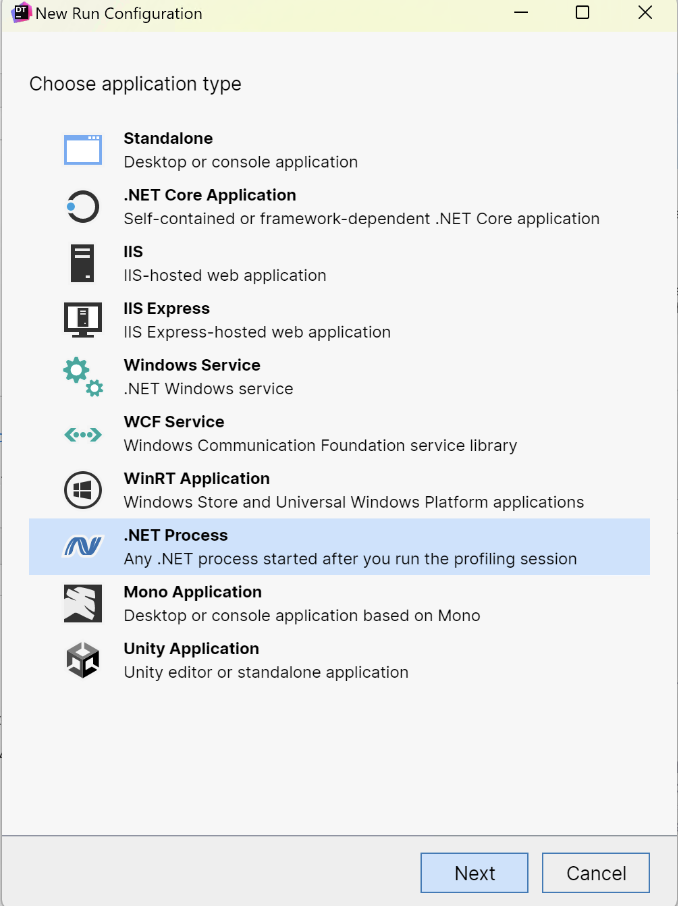
- After launching dotTrace, go to the Profiling tab and click + in Choose what you want to profile section. Then, select .NET Process in the New Run Configuration dialog and click Next. Keep the default configuration and click Save.
- In the Choose how you want to profile it section, be sure to select the correct Profiling Type: Timeline is the default, but you can also select Sampling or Tracing if you’ve been asked to collect a sampling or tracing snapshot.
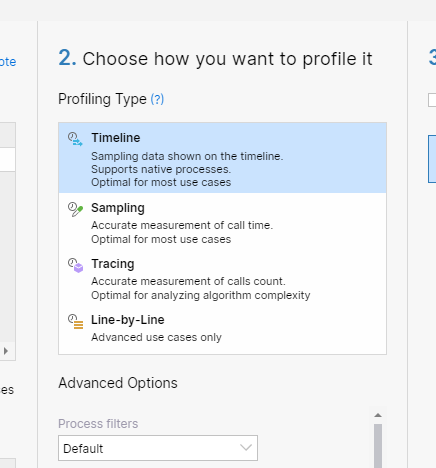
To learn about the difference between the profiling types, refer to the dotTrace documentation here.
- If there’s a performance problem during Rider’s startup phase, tick the Collect profiling data from start checkbox.
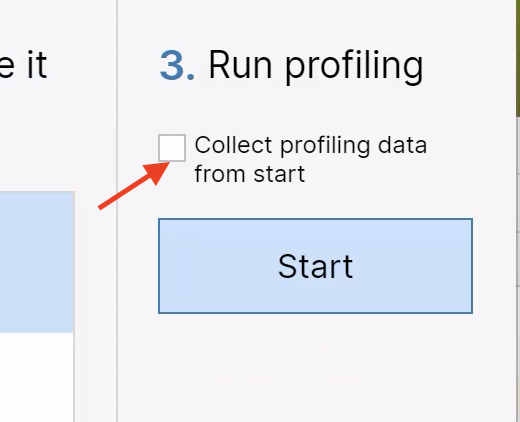
Make sure to enable this feature if you get a Rider error report during startup,
for example if Rider crashes or lags before the Welcome dialog appears or you see a critical error message before opening any project in Rider.
- Run Rider
Performance issues during startup:
- Once Rider starts, open your solution.
- Wait for the solution to finish loading and for Rider to load all of the caches, ensuring the problem is reproduced.
- Click the Get Snapshot and Wait button in the profiling controller window.
Performance issues in other scenarios:
- Once the Rider starts, open your solution.
- Click the Start button in the profiling controller window when you’re ready to reproduce the problem.
- Perform the actions that lead to the performance issue in Rider, such as typing, switching between documents, and building projects.
- Once the relevant actions have been completed, click the Get Snapshot and Wait button in the profiling controller window.
- The trace will be opened in the dotTrace viewer automatically. If you would like to create a new snapshot without saving the current one, click Drop in the profiling controller window.
- In the dotTrace Viewer, click File | Save Snapshot… in the toolbar and save the resulting snapshot.
- Compress (zip) the snapshot file.
- Use the JetBrains Upload Service to upload the zip package and save the upload ID.
- You can also create a new support ticket or submit a support request via Help | Contact Support in Rider.
In the issue, briefly describe the performance problems you're experiencing, making sure to provide your upload ID. If you already have a corresponding support ticket, please send the upload ID to the relevant support engineer.
Please sign in to leave a comment.
I'm having problems with the Embedded Profiler after Step #2 - i.e. nothing happens when I click Start Sampling or Start Timeline, there is no message at the bottom of the IDE. Another colleague has the same problem. Thanks.
Rider 2017.1.2
Build #RD-171.4456.3568, built on September 15, 2017
You have a perpetual fallback license for this version
Subscription is active until September 10, 2018
JRE: 1.8.0_112-release-736-b22 amd64
JVM: OpenJDK 64-Bit Server VM by JetBrains s.r.o
Windows 7 6.1
Linux and Rider 2021.1.2
* There is no 'Create Backend Thread Dumps", there is 'Collect Backend Thread Dumps" instead
* After click this menu I got error: "LLDB not available at /usr/lib/llvm-3.9/bin/lldb". It would be better to mention in article If I had to install some prerequisites .
* Why 3.9 ? It's already five years old.
Hi Konstantin,
Thank you for pointing us to this issue.
I fixed the article. Now to diagnose CPU performance issues for dotnet Rider process there is an action `Help | Diagnostic tools | Profile Backend with Sampling`.